Digging deeper into disparities in affordable housing production
March 18, 2024 — We recently came across some excellent data-based reporting in Gothamist from David Brand and Jaclyn Jeffrey-Wilensky on affordable housing production in New York City. Specifically, the piece identified wide disparities between and among City Council districts in terms of how much affordable housing has been produced in the period starting at the beginning of 2022. (The latest iteration of the New York Housing Conference’s NYC Housing Tracker covers the period from 2014 through 2022.)
We thought we would add demographics to the data and also throw in the extent to which New York City Housing Authority Housing (NYCHA) housing exists in each Council District. As to the first, we pulled 2020 Census data from the Population FactFinder of the New York City Department of Planning. For NYCHA housing we did not immediately come across an easily accessible compilation of units per Council District (see sidebar). What we have used as a very rough proxy is the number of NYCHA addresses per Council District, calculated from this data set available in NYC Open Data.
The full set of data we pulled together (with “Affordable Housing Development, 2022-24” coming directly from the Gothamist article) is available for download by clicking the link at the bottom of this page.
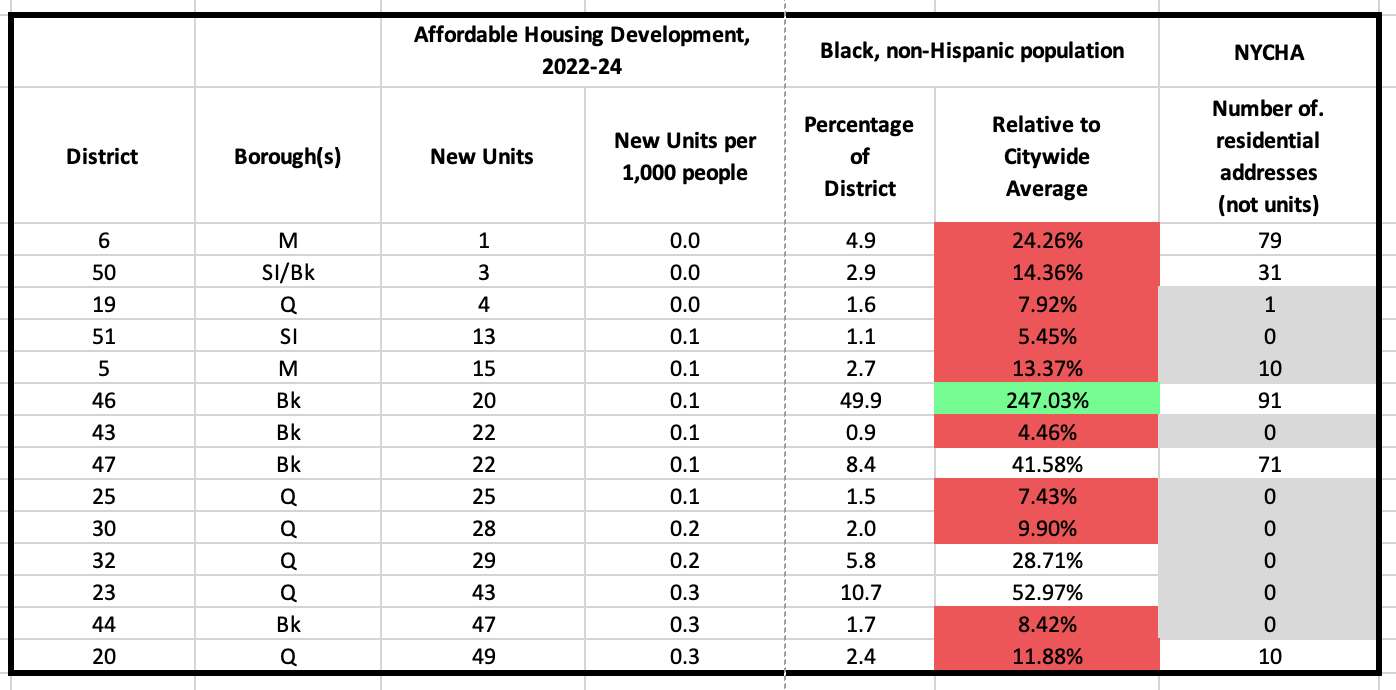
Here is what we noticed. There are 51 City Council districts in New York City. Of these, 14 districts each had, per Gothamist analysis, fewer than 50 units built in 2022 to 2024. (By contrast, there were more than 1,000 units built in each of nine council districts.)
Of the 14 lowest producing Council districts, 10 have Black, non-Hispanic populations less than 5.0 percent, which is less than a quarter of the citywide population of Black, non-Hispanics (a relative population this low is highlighted in red; where the relative population percentage is at least 75 percent higher than the citywide average, that is highlighted in greeen). Half of those 14 Council districts apparently have zero NYCHA residential addresses; another has but one, and two have only 10 (all of these are highlighted in grey). By contrast, 15 Council districts have more than 100 NYCHA residential addresses).
Both the “City of Yes” proposal from the administration of Mayor Adams and the “Fair Housing Framework” enacted by City Council Speaker Adrienne Adams should work to stop or slow down further increases in these marked imbalances, but neither is designed to create a remedial counterbalance. That is, a relatively even level of production going forward is better than replicating what has been done in the past, but the only way that the deliberate and profound imbalances that were created and that persist can be reversed is if new construction is focused where the resistance to affordable housing development has historicdally been most intense. This remedial path is one that, sadly, is still not spoken of, either because doing so is believed to be too perilous or because New York City’s unholy alliance of traditional segregationists and neo-segregationists, for their own reasons, like our deeply segregated status quo.
Affordable Housing by Council District, 2022-24,
with Demographic and NYCHA data